GridArb
Whether a gas plant makes money today, across three wholesale markets, from live operator data.
The question
A gas-fired plant earns the difference between what it sells power for and what it pays for fuel. That margin — the spark spread — decides which plants run and which sit idle, and it is the single most-quoted number in thermal generation. It is also surprisingly hard to look up. Every ISO publishes prices in its own format, gas trades somewhere else entirely, and no free tool puts them side by side. I wanted to see all three markets at once.
What I built
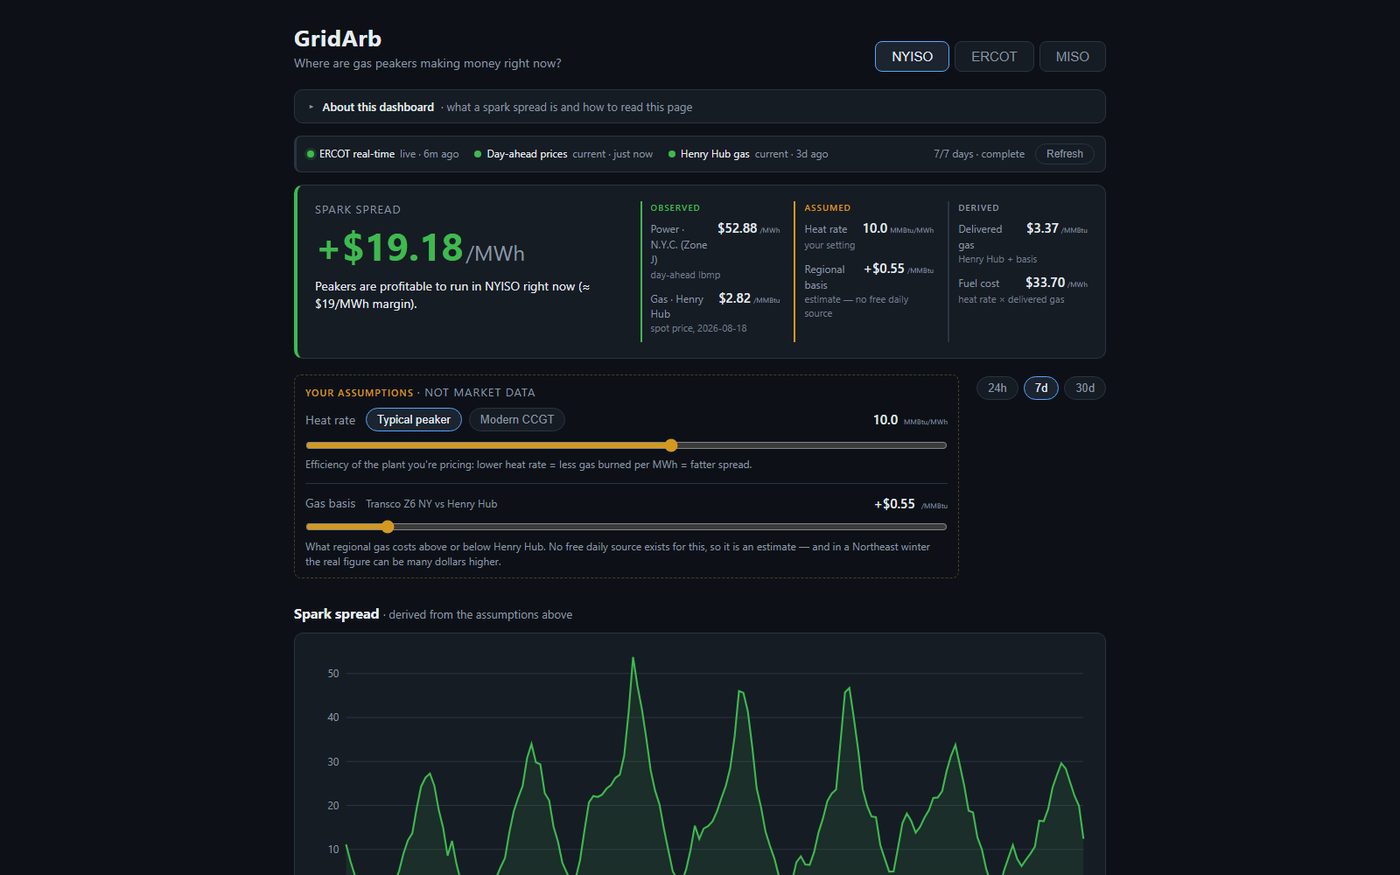
A live dashboard computing spark spread — power price minus heat rate times gas price — for NYISO (N.Y.C. Zone J), ERCOT (Hub Average) and MISO (Indiana Hub), against Henry Hub spot from the St. Louis Fed. Each region gets a plain-English readout, a 24-hour / 7-day / 30-day spread chart with the breakeven line drawn, and an adjustable heat rate with peaker and combined-cycle presets.
Every source is key-free and read directly from the operator: NYISO's day-ahead zonal CSVs, MISO's ex-post LMP market reports, ERCOT's day-ahead settlement-point HTML plus its live 15-minute price feed, and FRED's Henry Hub series. No resold data, no registration, no credentials in the bundle.
An in-app explainer covers what a spark spread is, how to read the breakeven line, and what the number deliberately excludes — collapsed by default so the figures lead the page, and it remembers whichever state you leave it in.
The hard part — The number is far more sensitive than it looks
Regional delivered gas is not Henry Hub. It is Henry Hub plus a basis differential that varies by region and blows out in winter. There is no free daily regional gas-basis series — I checked exhaustively. EIA's daily ICE gas-hub workbooks stop in 2017, and the current electricity workbook carries no gas and neither ERCOT nor NYISO.
So basis has to be estimated. And the estimate dominates the answer: moving NYISO's basis from $0.55 to $6.00 — an entirely plausible winter move — flips the headline spread from +$45.74 to −$8.76. Profitable to catastrophic, on an assumption.
The design rule that came out of this governs the whole site: observed and assumed must be visually separated and never blended into one figure. Power prices and Henry Hub are observed. Heat rate and basis are assumptions, exposed as labelled user controls rather than presented as data. A separate panel — "What prices actually did" — is assumption-free by construction and carries the market-implied heat rate as the objective counterpart to the slider.
The browser could not reach any of the data
None of the four upstreams send CORS headers; ERCOT sends one pinned to its own domain. A plain static host therefore cannot fetch a single price. The fix was five CloudFront origins with a CloudFront Function stripping the routing prefix, so the deployed site proxies exactly what the dev server proxies and one code path is verified in all three environments.
FRED hangs for browsers but answers curl
The Henry Hub endpoint returned nothing — not an error, a hang — when the User-Agent was CloudFront's, empty, or browser-like, including a genuine Chrome string. A controlled test ruled out rate limiting. It answers a curl agent instantly. Fixed with an origin custom header, deliberately not forwarding the viewer's real UA.
The archives lie about their own contents
NYISO's daily CSVs age out after about ten days; older data lives in monthly zips. Those zips use data descriptors, so local file headers carry zeroed sizes — a reader must walk back from the end-of-central-directory record to get real offsets. Handled in the browser with DecompressionStream and no library.
The site was silently a month stale
Reachability had been conflated with recency: the app was fetching fine and showing old numbers. Fetch time and data-through time are now tracked separately, with per-source poll cadences, refresh on tab focus and reconnect, and explicit coverage states. FRED's gas series legitimately runs about eight days behind, so gas now shows as "lagging" rather than pretending to be current.
What this does not tell you
- Regional gas basis is an estimate, not observed data — treat NYISO winter spreads as optimistic.
- ISO-NE requires a registered account and PJM an API key; both are deferred to a version that can hold credentials server-side.
- The spread deliberately excludes variable O&M, start costs, emissions allowances and capacity payments.