GridScale
Where the next wave of data-center load is being built, and what it will lean on.
The question
Data-center market intelligence keeps getting sold as a mapping exercise. Knowing where facilities sit matters far less than knowing where the next wave is being built and what it will lean on. Two public datasets answer that together and are almost never looked at together: facility-level data-center development, and state power-system fundamentals. The question is how large the pipeline is relative to the grid that has to carry it.
What I built
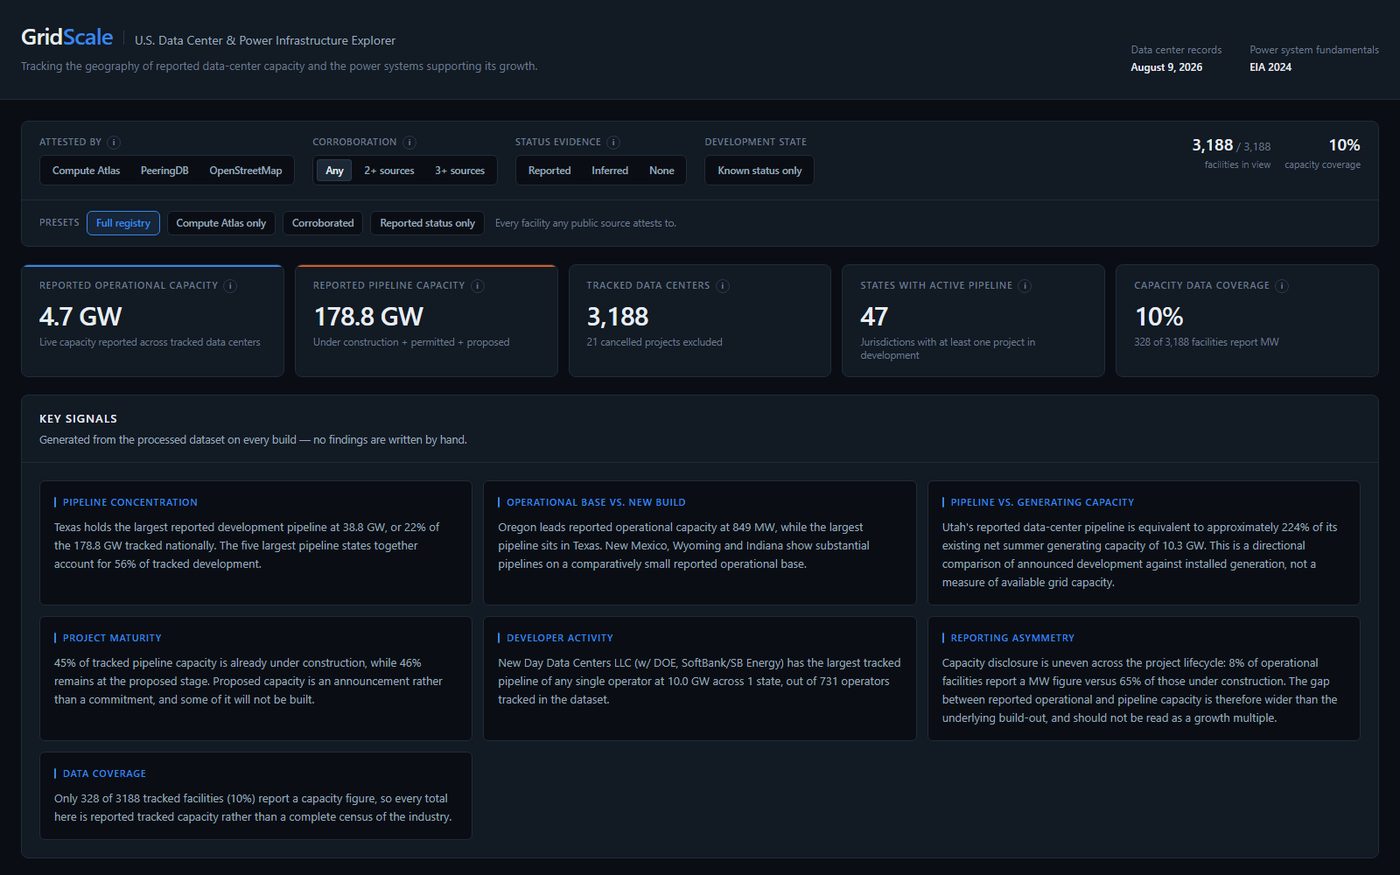
A dashboard that moves from national overview to state comparison to individual facility without leaving one page, joining a fused registry of 3,188 tracked data centers to EIA state-level installed capacity, net generation, retail sales and average price.
Nine framed questions rather than a pile of charts: which states hold the most operational capacity, which hold the largest pipelines, how concentrated development is, how the pipeline compares to existing generating capacity, whether major markets coincide with particular electricity-cost environments, which operators are furthest ahead, how mature the pipeline is, which states look emerging rather than established — and how complete the underlying data is, and which way its gaps bias the answer.
The whole pipeline runs with no credentials. EIA's v2 API is used when a key is present and otherwise falls back to the public State Electricity Profile workbooks — the same primary collections that back the API.
The hard part — Two datasets, two different reporting periods, one very easy lie
Data-center records are current. EIA fundamentals are the latest complete annual reporting year. Putting them in the same view invites a reader to treat them as simultaneous, and the resulting "pipeline as a share of state capacity" figure would be quietly wrong in a way nobody would catch.
The app never implies otherwise. The header labels the two vintages separately — data-center records as of a date, power-system fundamentals as an EIA year — and the methodology section repeats the distinction rather than burying it once.
Sourcing had its own obstacle. Compute Atlas serves its public API from behind Cloudflare, which answers non-browser clients with a JavaScript interstitial instead of JSON. The fetcher tries the live API, falls back to the project's own open-data repository publishing the identical dataset, and records which source actually answered in the metadata — surfaced in the app's data-quality panel rather than hidden.
What this does not tell you
- Reported capacity is incomplete across all public data-center sources; the app quantifies that gap rather than papering over it.
- Announced pipeline is not committed capacity — announcements are cancelled and deferred routinely.
- State-level power fundamentals cannot resolve intrastate transmission constraints, which is often where the real limit sits.