CAISO Market Pulse
An exhaustive local terminal for California wholesale power — no sampling, no substitutes.
The question
California runs the most volatile major power market in the country — routinely negative in the afternoon, sharply positive at sunset. Most tools that show it aggregate to a handful of hubs, which is exactly where the interesting behaviour disappears. Congestion and negative pricing are node-level phenomena. I wanted every node.
What I built
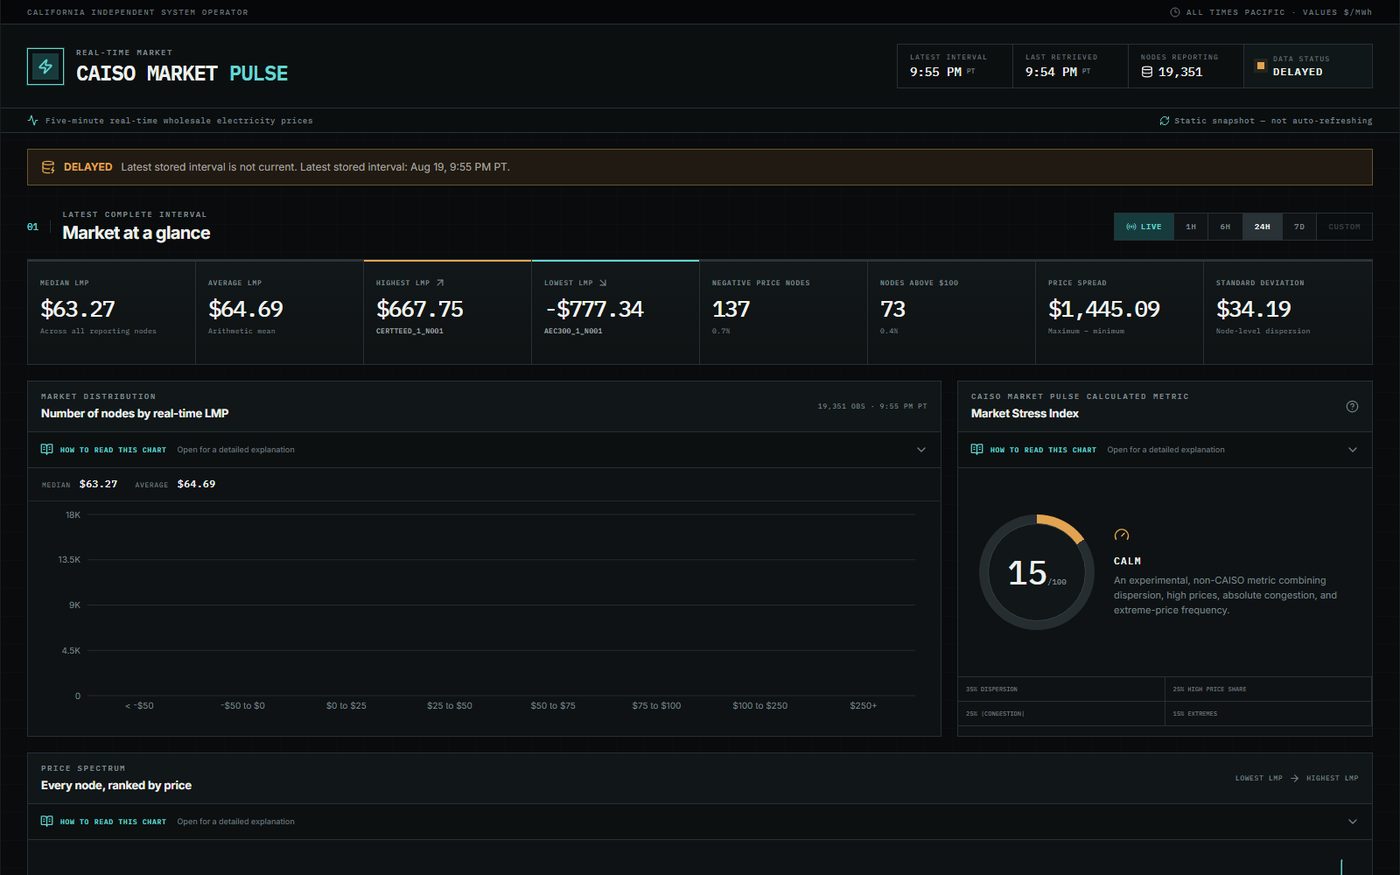
A local market terminal that retrieves, validates, stores and visualises one dataset properly: CAISO's PRC_INTVL_LMP, version 3, real-time market, all-node query, at five-minute resolution — decomposed into energy, congestion, loss and GHG components wherever CAISO supplies them.
Market median, mean, extremes, spread and dispersion; the full LMP distribution and a price spectrum containing every reporting node; positive and negative congestion rankings with an energy-versus-congestion scatter; negative-price thresholds and historical negative-price share; a searchable, sortable node directory with CSV export; and per-node component history.
A resumable backfill that divides a requested UTC range into sequential hourly calls, saves every successful hour immediately, logs failures to SQLite, and skips completed hours when restarted — so a run interrupted at hour 40 of 200 costs nothing.
The version linked here is a static snapshot, because a 2.2-million-row database behind a polling service cannot be served from object storage. Rather than reimplement the aggregations in a build script — and risk them drifting from the real ones — the bake driver calls the actual API and stores its responses, so the hosted figures come from exactly the code that produces the live ones. Pagination, sorting and search move to the browser; every one of the 19,351 nodes is present in the table.
The hard part — Refusing the three shortcuts that would have made it easier
CAISO returns separate component CSVs inside a single ZIP, and the obvious approach is to identify each by its filename. Those names are not a stable contract. The parser reads each row's own LMP_TYPE value instead, so a rename upstream cannot silently mislabel congestion as energy.
Null values stay null. Converting a missing market value to zero would flow straight into every mean, every negative-price share and every dispersion figure on the page — a missing price is not a price of zero, and treating it as one manufactures data.
Version 1 displays no node coordinates. It would be easy to geocode node names into a handsome map, and the result would be fiction dressed as geography. A map goes in only if a CAISO-native source supplies authoritative locations. The same discipline covers availability: when CAISO is down the interface says CAISO UNAVAILABLE — alongside LIVE, DELAYED and PARTIAL — rather than showing stale numbers as current.
What this does not tell you
- The hosted version is a frozen snapshot, not a live feed — the running application polls CAISO every five minutes against a local database. The interface says so rather than implying currency.
- Per-node history in the snapshot covers the 240 most extreme nodes by price and congestion; the other 19,111 show their latest observation only. All 19,351 are present in the node table.
- These are wholesale prices in $/MWh — not retail rates, and not a generation dataset.
- No geographic layer until CAISO supplies authoritative node coordinates.
- The Market Stress Index is labelled experimental in the interface because that is what it is.
- Independent project; not sponsored or endorsed by CAISO.